TraceViz: Visualizing traceroute output with graphivz 2008-05-29
Update: Belorussian translation.
At Edgeio we had a fairly complicated network setup, and at one point I quickly hacked together a Ruby script to merge the paths generated by multiple traceroute runs together into directed graphs, showing the routing from a few selected host in our environment to all our other hosts. I generated dot-files suitable for Graphviz from it.
It was a helpful way of looking for weird inconsistencies in routing, in particular between our two locations.
Unfortunately, when Edgeio closed down I think the script was lost, and in any case if it isn't I wouldn't be able to get permission to release it without more hassle than it'd take me to recreate it from scratch. So recreate it from scratch is exactly what I did.
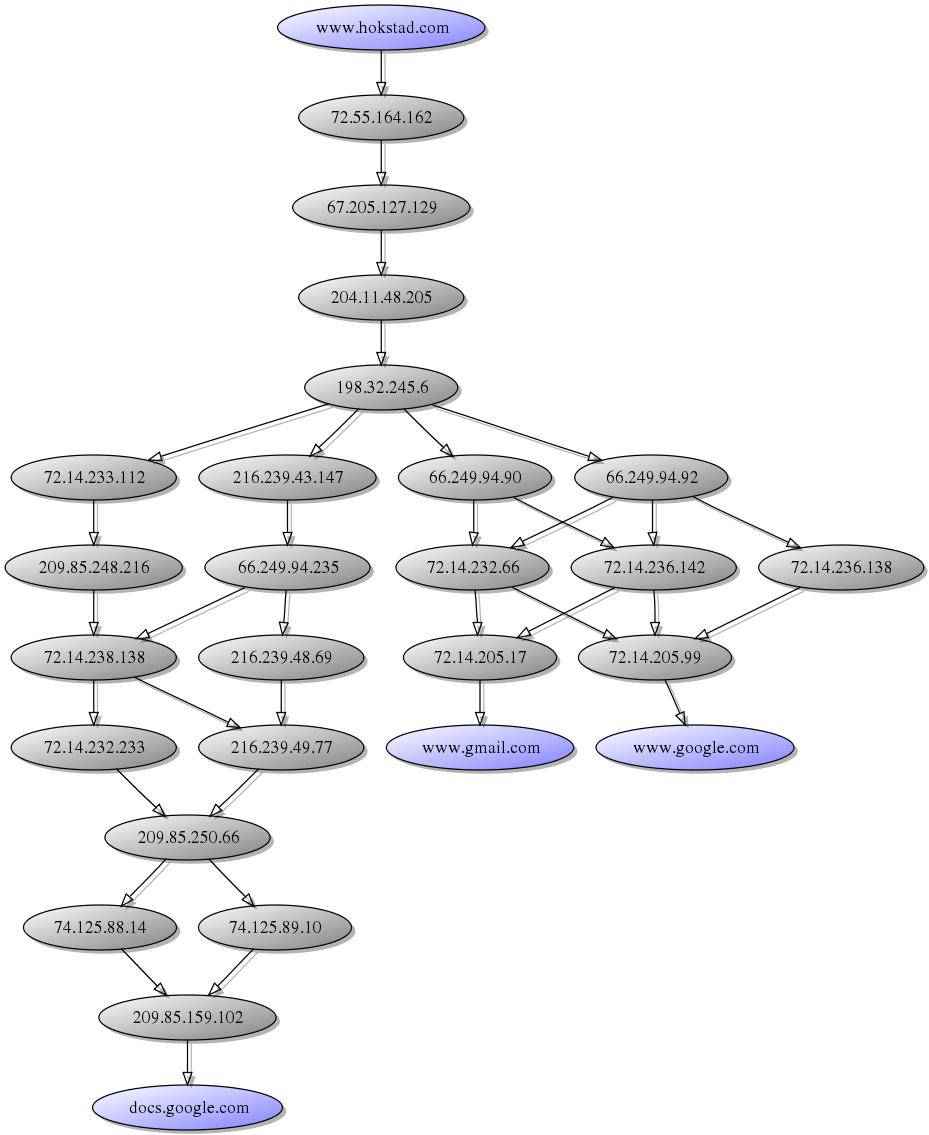
Here's an example of a traceroute from www.hokstad.com to www.gmail.com, docs.google.com and www.google.com (scaled down):
(Gradients and shadows courtesy of my XSL transform to make graphviz output prettier)
There's a couple of caveats: I just strip out failed probes, and I don't try to reconcile the names of the endpoints (which I preferred to include for readability) with the IP addresses of the trace, so the first/last grey nodes before the named/blue nodes may be redundant.
This script by default runs traceroute 3 times for each target, and that's the reason why there are more possible paths than endpoints, and it illustrates failover and/or load balancing mostly, but can also be affected by fluctuations in dynamic routing. It's usually fairly stable, and in fact at Edgeio I found several network problems by re-running the script when something was up and looking at how the routing had changed. 3 runs seemed sufficient for my use, but for large networks adding more may give a better picture of the routing.
The Ruby script
You can find the full script here, but here are the guts:
First I defined a convenience method to run traceroute and capture the output. This is intended for a POSIX OS (Linux / Unix / BSD's), but mainly requires a working traceroute where the output is a number of lines starting with a hop count and then the ip address. TRACEROUTE must be set to a valid traceroute command.
    TRACEROUTE=`which traceroute`.chomp

    def traceroute host
      `#{TRACEROUTE} -n #{host}`
    end
The TraceViz class does the gruntwork. @edges contains the edges of the graph, in other words which pairs of ip addresses represent a hop further in the network. @nodes contains a set of the ip addresses found. @targets contains the hostnames of the start and end-points - it's used only to style them differently:
    class TraceViz
      def initialize(times,timeout)
        @times,@timeout = times,timeout
        @edges = Set.new
        @nodes = Set.new
        @targets = Set.new
        @this_host = Socket.gethostname
        @targets << @this_host
      end
    </pre>
The #trace method executes the traceroutes, and enforces a timeout:
      def trace host
        @times.times do |i|
          STDERR.puts "Trace ##{i+1} for #{host}"
          Timeout::timeout(@timeout) do
            process_trace(host,traceroute(host))
          end rescue nil
        end
      end
#process_trace handles the parsing of the trace, by splitting the output into lines, extracting the IP addresses, and then adding each of them to @nodes, and adding each pair to @edges. I don't care if we've seen them before, since I use Set's so the previous (identical) nodes/edges will just overwrite the same values:
      def process_trace host,trace
        @targets << host
        trace = [@this_host] + trace.collect do |line|
          line=line.split
          line[0].to_i > 0 && line[1] != "*" ? line[1] : nil
        end.compact
        trace << host
        trace.each {|h| @nodes << h }
        trace.each_cons(2) {|h1,h2| @edges << [h1,h2] }
      end
Finally #to_dot generates a graphviz compatible directed graph:
     def to_dot
        res = "digraph G {"
        @edges.each { |h1,h2| res << "   \"#{h1}\"->\"#{h2}\"\n" }
        @nodes.each do |n|
          color = @targets.member?(n) ? "lightblue" : "lightgrey"
          res << "  \"#{n}\" [style=filled fillcolor=#{color}]\n"
        end
        res << "}"
      end
    end
Running it and generating the image
First run the script to generate the dot-files, and then generate an SVG file from it:
ruby traceviz.rb www.google.com www.gmail.com docs.google.com >trace.dot
dot -Tsvg trace.dot >trace.svg
Optionally, process the script with my XSL transform to make it prettier (adding the gradients from above etc) - I'm using xsltproc from libxslt:
xsltproc notugly.xsl trace.svg >trace-notugly.svg
Then I used "rsvg" from librsvg2 to turn it into a PNG:
rsvg trace-notugly.svg traceviz.png
Of course these steps are easily enough wrapped into a script.